

No results for ""
Bar Streaming
LiveBar Streaming is one of TrueData Sheets' most powerful features. It lets you pull live OHLC candlestick data directly into your spreadsheet - starting from any historical date you choose, replaying all past bars, and then continuously appending new candles as they form in real time.
Live Bar Append
New candles appear automatically as each interval closes - no manual refresh needed.
Historical Replay
Load bars from any past date. All completed candles replay first, then live streaming kicks in.
Built-in Candlestick Chart
Optionally render a live updating candlestick chart alongside your data, right in the sheet.
How to Start Bar Streaming
Follow these steps to begin streaming live OHLC bars into your sheet:
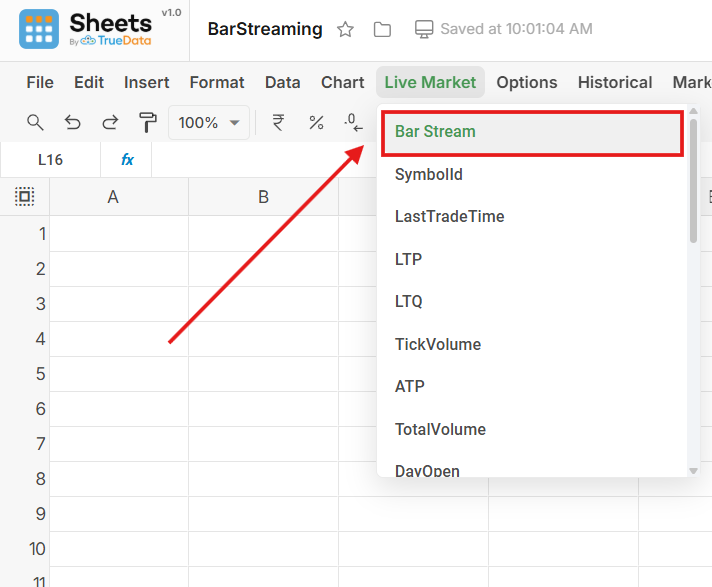
- Open the LiveMarket panel from the toolbar.
- Click Bar Stream to open the streaming configuration.
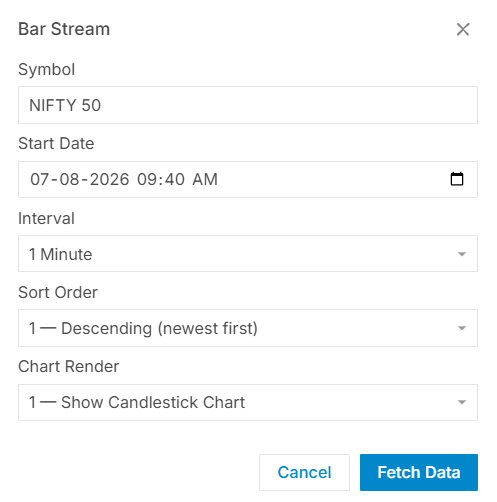
- Enter the symbol and your desired start date.
- Choose the interval (supported: 1m, 5m).
- Click Stream - historical bars replay first, then live bars follow.
Note: The video plays at normal speed until the first bar completes, then speeds up to quickly show the remaining historical bars forming.
- Streaming only works during market hours (9:15 AM – 3:30 PM IST)
- On start, all completed bars from your start date replay first, then live bars follow
- Closing or refreshing the sheet stops the stream - click Stream again to resume
- Supported intervals: 1m, 5m
Sheets by Truedata
Empowering traders and analysts with high-performance real-time market data directly within their spreadsheets.
Resources
Support
© 2026 TrueData Market Data Services LLP. All rights reserved.